What the 2025 reports show
Headline finding: Chelmsford Water District is the only supplier in this table with a running-average violation in 2025, at 22.2 ppt across a quarterly range of 14.4 to 28.9, with notices mailed for the first, third and fourth quarters. Woburn sits right at the line: its Horn Pond wells averaged 19.15 at the highest quarter with a 12.0 to 22.9 range, one October 2025 sample over 20, and a 2023 notice of non-compliance behind it. Sudbury reached 18.7 in monthly sampling while its East Street filtration plant was about 90 percent complete, Westford held a 17.0 running average, and Maynard averaged 12.6 with single samples as high as 23.9.
Treatment is arriving fast: Several suppliers crossed from exposure to treatment in the last two years. Acton Water District now runs PFAS treatment at all three plants, North Acton since June 2024, South Acton since February 25, 2026 and Central Acton since April 28, 2026. Burlington Mill Pond water tested non-detect after its filter plant, North Chelmsford runs granular activated carbon and held its highest quarterly average to 2.86 ppt, and Woburn expected its removal facility online in late summer 2026.
How to use your row: Find your town, confirm the supplier against your water bill, and read the source link on that row. Chelmsford has three districts with very different results, so a Chelmsford Water District street and a North Chelmsford street should not be read as the same answer. Blended towns such as Burlington, Wilmington and Woburn mix MWRA water with local wells, so your tap sits somewhere between the two figures. Private-well streets sit outside every public-system result and need individual testing.
State and federal limits side by side
Massachusetts standard: The state maximum of 20 ppt applies to the sum of six compounds (PFOS, PFOA, PFHxS, PFNA, PFHpA and PFDA) for community and non-transient systems, in force since October 2020. Compliance is judged on running quarterly averages, and an exceedance triggers mailed notices, public updates and a corrective treatment plan under MassDEP oversight. That notice process is exactly what Chelmsford Water District customers saw across 2025.
Federal standards: The 2024 federal rule set 4 ppt each for PFOA and PFOS plus limits on four more compounds, with initial monitoring due by April 2027. In May 2026 EPA proposed keeping the two 4 ppt limits, rescinding the limits on the other four compounds, and letting systems request extra time to April 2031 for PFOA and PFOS compliance. Those are proposals, so the state 20 ppt PFAS6 limit remains the enforceable number in Massachusetts today.
What limits mean at the tap: Limits bind suppliers on averages rather than single samples, which is why Woburn could record a 22.9 sample and still meet its quarterly standard. Home decisions use the same logic in reverse: a single under-sink reading proves little without repeat sampling through a certified lab. Supplier reports that print both a range and an average tell more truth than any headline figure alone.
The supplier table
Reading guide: PFAS6 figures are in parts per trillion from each supplier 2025 report, with the highest running or quarterly average first and the sample range after it. MWRA community reports describe regional water as showing only trace amounts well below 20 ppt rather than printing a single figure. Rows marked not found mean we could not locate a published figure in September 2026, not that the water is untested; the linked page is where that supplier posts its annual report.
Standout rows: Chelmsford Water District and Woburn are the two rows at or over the limit, both with treatment under construction or recently scheduled. Sudbury at 18.7 and Westford at a 17.0 running average sit close behind, and Maynard recorded single samples above 20 while meeting the limit on average. At the low end, Burlington Mill Pond tested non-detect after treatment, Andover averaged 0.53, North Reading 2.46, North Chelmsford 2.86, North Andover 3.0 and Wilmington 4.27, while MWRA-supplied Bedford, Lexington, Reading and Stoneham report trace levels only.
| Town | Supplier | PFAS6 2025 (ppt) | Status | Treatment note | Source |
|---|---|---|---|---|---|
| Chelmsford | Chelmsford Water District | 22.2 running avg (14.4–28.9 quarterly) | Above 20 limit; Q1, Q3, Q4 2025 violations | Carbon filter plant under construction at Crooked Spring; Riverneck next | CWD 2025 report; CWD PFAS page |
| North Chelmsford | North Chelmsford Water District | 2.86 highest quarterly avg (ND–2.86) | Below limit | Granular activated carbon at treatment plant | NCWD 2025 report |
| East Chelmsford | East Chelmsford Water District | Not found | Not found | Not found | District site |
| Lowell | Lowell Regional Water Utility | 12.5 highest (ND–12.5) | Below limit | Merrimack River surface supply | Lowell 2025 report |
| Billerica | Billerica Water Division | 12.1 highest (2.65–12.1) | Below limit | Town treatment plant | Billerica 2025 report |
| Tewksbury | Tewksbury Water Dept | 10.4 highest (ND–10.4); 4.45 avg | Below limit | Merrimack River surface supply, carbon filters | Tewksbury 2025 report |
| Westford | Westford Water Dept | 17.0 running avg (11.7–18.4) | Below limit, close to it | See town PFAS treatment page | Westford 2025 report |
| Dracut | Dracut Water Supply District | Not found | Not found | Buys part of its supply from Lowell | DWSD reports |
| Tyngsborough | Tyngsborough WD (buys from Lowell + Pennichuck) | 12.5 highest (ND–12.5) | Below limit | Purchased, treated supply | TWD 2025 report |
| Dunstable | Dunstable Water Dept + wells | Not found | Not found | Well streets test individually | Owner lab test |
| Groton | Groton Water Dept + wells | Not found | Not found | Well streets test individually | Groton Water annual report |
| Pepperell | Pepperell DPW Water Division | 11.77 avg at Jersey Street (7.24–17.3) | Below limit | Not stated | Pepperell 2025 report |
| Ayer | Ayer DPW Water | Not found | Not found | Not found | Ayer DPW annual report |
| Littleton | Littleton Water Dept | 6.66 | Below limit | Not stated | LWD 2025 report |
| Acton | Acton Water District | Figures in district data tables | District reports all plants compliant | Treatment at North (Jun 2024), South (Feb 25, 2026) and Central (Apr 28, 2026) plants | AWD PFAS page |
| Carlisle | Private wells | Test individually | No community system | Owner lab testing | Owner lab test |
| Bedford | MWRA (100% in 2025) | Trace, well below 20 | Below limit | Regional supply | Bedford 2026 report |
| Concord | Concord Water Division | 8.9 highest (2.8–8.9) | Below limit | Not stated | Concord 2025 report |
| Burlington | MWRA 59% + Mill Pond 38% | Mill Pond ND; MWRA share trace | Below limit | Mill Pond filter plant built | Burlington 2026 report |
| Wilmington | Town wells 77% + MWRA 23% | 4.27 highest quarterly avg (ND–9.2) | Below limit | Well water treated at town plants | Wilmington 2026 report |
| North Reading | Andover water (100% in 2025) | 2.46 (ND–3.44) | Below limit | Purchased from Andover | North Reading 2025 report |
| Reading | MWRA | Trace, well below 20 | Below limit | Regional supply | Reading 2026 report |
| Woburn | MWRA 52.5% + Horn Pond wells 47.5% | Horn Pond 19.15 highest (12.0–22.9) | Met quarterly limit; one Oct 2025 sample over 20 | Removal facility expected online late summer 2026 | Woburn 2026 report |
| Lexington | MWRA | Trace, well below 20 | Below limit | Regional supply | Lexington 2026 report |
| Lincoln | Lincoln Water Dept | Flint's Pond ND; Tower Road well 9.42–14.5 | Below limit | Well water blended with pond water | Lincoln 2025 report |
| Sudbury | Sudbury Water District | 18.7 highest monthly (ND–18.7) | Below limit, close to it | East Street PFAS filtration ~90% complete | SWD 2025 report |
| Andover | Andover Water Division | 0.53 quarterly (ND–2.1) | Below limit | Haggetts Pond surface supply | Andover 2025 report |
| North Andover | North Andover Water Dept | 3.0 highest quarterly avg (ND–3.0) | Below limit | Town treatment plant | North Andover 2025 report |
| Lawrence | Lawrence Water Works | PFAS sum 2.27–7.79 | Below limit | Merrimack River surface supply | Lawrence 2025 report |
| Methuen | Methuen Water Dept | 2.66 (<2.0–3.48) | Below limit | Town treatment plant | Methuen 2025 report |
| Stoneham | MWRA | Trace, well below 20 | Below limit | Regional supply | Stoneham 2026 report |
| Maynard | Maynard DPW Water | 12.60 avg (5.94–23.90) | Met limit on average; one-off samples above 20 | Well supply | Maynard 2025 report |
| Stow | Small systems + wells | Test individually | No single town system | Owner lab testing | Owner lab test |
Methodology: where every finding comes from
Primary reports: PFAS6 figures come from 2025 Consumer Confidence Reports read directly for Chelmsford Water District, North Chelmsford, Billerica, Tewksbury, Westford, Pepperell, Concord, Andover, North Reading, North Andover, Lawrence, Lincoln, Maynard, Lowell, Methuen, Tyngsborough, Littleton and Sudbury, and from the MWRA 2026 community reports for Bedford, Burlington, Lexington, Reading, Stoneham, Wilmington and Woburn, which carry each town letter with local well results. Chelmsford Water District figures come from its 2025 report and PFAS page, and Acton treatment dates from the district PFAS page, all read September 2026.
How figures are reported: Suppliers print PFAS6 in different ways, as a running annual average, a highest quarterly average, or a highest single result, so each row names which measure it shows. Ranges run from the lowest to the highest sample in 2025, with ND meaning not detected. Burlington filter plant cost and background come from the town response in the 2024 MWRA Advisory Board rate survey. No figure comes from our own sampling.
Coverage limits: Rows marked not found stay empty until a supplier figure turns up; the state drinking water data portal holds per-system sampling for readers who want the raw numbers. Nashua and Hudson fall under New Hampshire standards rather than the Massachusetts PFAS6 rule, so they sit outside this table. Private wells follow separate testing guidance for owners rather than supplier reports.
Treatment timelines worth watching
Chelmsford build: Chelmsford Water District broke ground on granular activated carbon treatment at Crooked Spring, with Riverneck work staged behind it. Quarterly notices continue until running averages hold below the limit across four quarters, so the mail remains the compliance signal to watch rather than any single announcement. North Chelmsford already runs carbon filtration, which is why its numbers sit near the bottom of the table despite sharing the town name.
Woburn and Sudbury next: Woburn reported one October 2025 sample over the limit and expected its Horn Pond removal facility online in late summer 2026, while Sudbury had its East Street filtration plant about 90 percent complete with a separate design underway for Wells 4 and 6. Both are worth checking in the 2026 reports that publish next July. Readings close to the limit plus treatment in progress is the pattern where results can change fastest.
What finished treatment looks like: Acton and Burlington show the far side of the process. Acton brought treatment online at all three plants between June 2024 and April 2026, and Burlington Mill Pond water tested non-detect after its filter plant, with ongoing media and operating costs the town described in survey responses. MWRA towns inherit regional compliance without local builds, and their reports describe only trace PFAS in the regional supply.
Home filter choices honestly compared
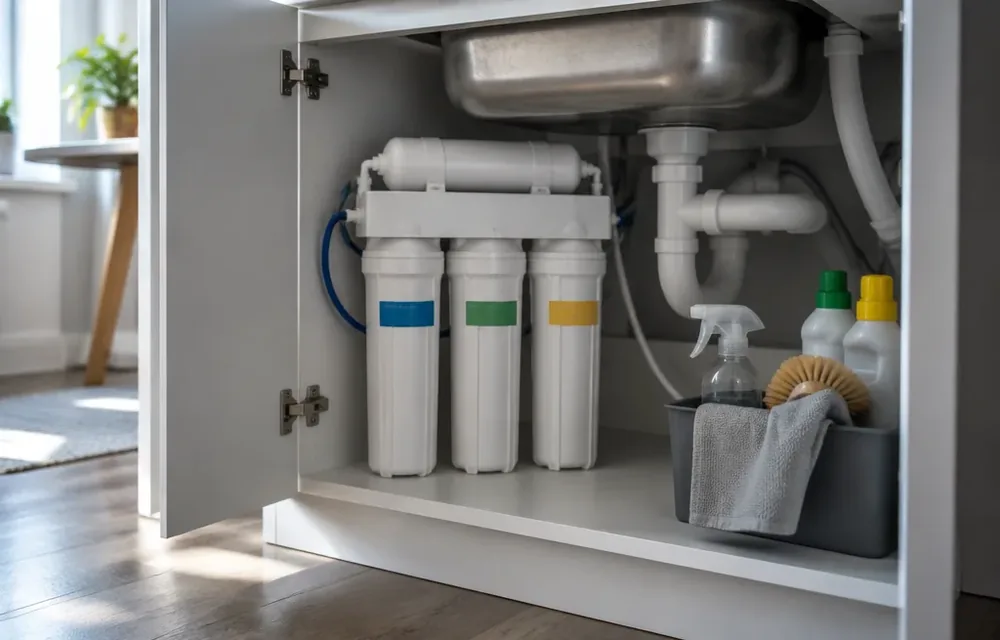
Certified point-of-use: Countertop and under-sink units certified to NSF/ANSI 53 or 58 for PFOA and PFOS reduction offer the documented home path. Check the certification listing for the exact model rather than the box wording, since certified reduction claims differ by product and by compound. Certification plus independent evidence beats marketing alone every time.
What filters cannot do: No filter fixes a supplier violation, and whole-house PFAS treatment remains a specialist design well beyond standard softening or sediment work. Filters also need cartridge discipline, since exhausted media stops removing anything while looking unchanged. Homes on private wells need lab testing first, because treatment without numbers targets nothing.
Where plumbing fits: A plumbing visit covers installing and servicing standard point-of-use and whole-house filtration, cartridge housings, bypass valves and softeners, and can position equipment for easy cartridge changes. PFAS remediation design for a whole supply sits with treatment specialists and supplier programs. That division keeps advice honest: plumbing work for the fixtures, contaminant strategy from testing and the supplier record.
When should you call about water quality in your town
Call signals: Call about quality-driven plumbing when you want a certified under-sink filter installed, when staining, odor or sediment accompanies pressure or flow complaints, when treatment equipment alarms or bypasses, or when a remodel opens walls over tired pipe worth renewing. Notices naming your supply merit a records check rather than panic, since running averages and plant zones decide what any letter means for your street.
What to say on the call: Call (978) 592-1168 with your town, supplier and district where known, notice wording with dates, and any lab sheets ready. Describe staining, odor and fixture patterns together with pressure behavior. That account lets the visit sequence testing review, treatment checks and piping options correctly across Chelmsford, Woburn and Sudbury.
Records that help most: Keep supplier reports, notice letters, lab sheets and treatment manuals in one folder with your town row printed on top. Homes that bring all four get faster diagnoses and narrower proposals. Update the folder yearly as new reports publish each July.
Near you
When to call
Related guides
Frequently asked questions
Does my town water exceed PFAS limits?
Among published 2025 figures, Chelmsford Water District exceeded the 20 ppt running average and Woburn Horn Pond wells had one sample over 20 while meeting the quarterly standard. Sudbury peaked at 18.7 and Westford averaged 17.0, while most other suppliers, including Andover, North Andover, North Chelmsford and MWRA, tested well below. Check your row and confirm your district before concluding anything.
Is North Chelmsford water the same as Chelmsford Water District?
No. They are separate districts with separate wells and treatment. North Chelmsford runs carbon filtration and held its highest quarterly PFAS6 average to 2.86 ppt in 2025, while Chelmsford Water District averaged 22.2 with treatment still under construction. Your water bill names your district.
Will a home filter remove PFAS?
Units certified to NSF/ANSI 53 or 58 for PFOA and PFOS reduction offer the documented path. Check the certification listing for your exact model, and replace cartridges on schedule since spent media stops working without any visible sign. Testing before and after installation proves the result.
Should I stop drinking my tap water over a PFAS notice?
Notices trigger information and treatment planning rather than do-not-drink orders, and compliance math spans four quarters rather than single samples. Read the notice for what it asks of you, consider a certified filter meanwhile, and follow supplier updates as treatment progresses. Boiling never removes PFAS.
Do private wells need PFAS testing?
Well owners test individually through certified labs since no supplier monitors private supplies. Treatment follows lab numbers rather than guesses. Keep results with the home records and retest on the schedule the lab suggests.
Still stuck?
Describe what you see when you call and a local specialist will guide the next step.